


In recent hours, the Aptos token experienced significant price volatility, leading to selling due to hours of network outages. Now that the network is stable again, there is a revival of interest in APT, with the price set for a recovery after the dip. Moreover, the current indicators in the chain are bullish, which brings positive market sentiment for buyers.
CVD ratio has a positive slope
Following the decline in Aptos’s value, long position holders rushed to offload their stakes, as evidenced by Coinglass data, which showed that around $100,000 of long positions were liquidated, contributing to the downtrend. However, as the network regained its footing and the price recovered from a low of $4.7, there was a noticeable increase in the accumulation and aggressive purchasing of APT tokens.
As a result, open interest (OI) figures have increased from $85 million to $88 million in recent hours, indicating growing interest in future transactions. Furthermore, the CVD spot has made a positive slope as it rose north and is currently trading at -1.146.
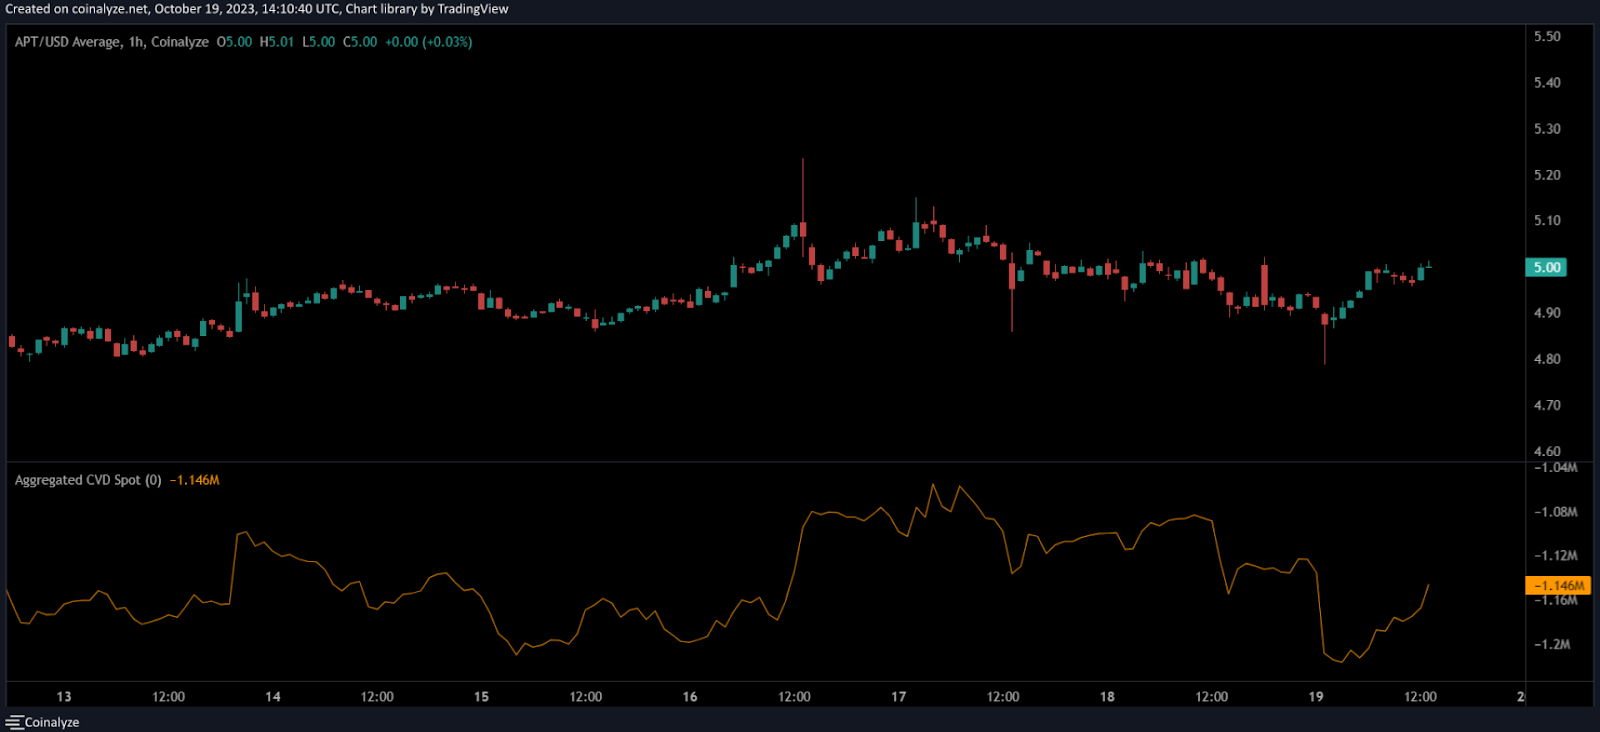
For a trader, this is a pure buying opportunity. When the CVD line shows a positive slope, it indicates increasing demand for the asset, indicating that buying opportunities are present.
On the other hand, a negative slope in the CVD line indicates an increase in the number of sellers accompanied by a decrease in demand. Typically, this serves as a signal to sell, causing traders to look for clues to sell their holdings.
The long/short ratio has risen sharply recently and is hovering at 1.0346. This indicates that the market is now leaning towards buyers as long positions now dominate at 51%. Additionally, intraday traders received a boost from a positive funding rate, further strengthening support levels.
What’s next for the APT Award?
APT price successfully recovered from the solid support level at $4.7 and recently broke above the bearish trendline. Still, the extended wick on the candlestick indicates active selling by the bulls during upward rallies. At the time of writing, Aptos’ price is trading at $5, up more than 0.9% from yesterday’s price.
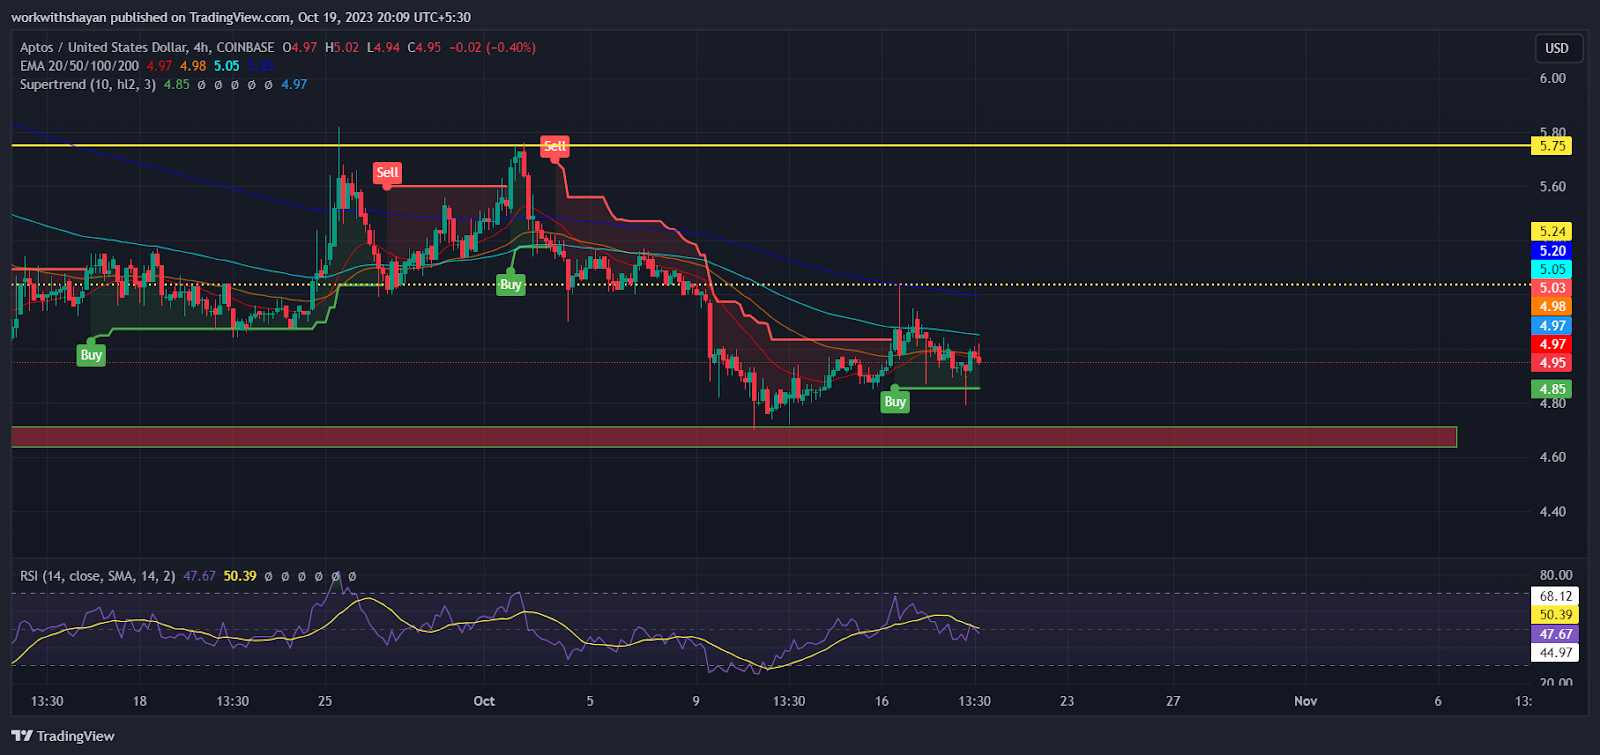
Signs of waning bullish momentum are clearly visible as price struggles to maintain momentum around the 20-day EMA, and the RSI declines from the midline.
With this opportunity, the bears are likely to attempt a rally, pushing the price below the USD 4.7 support. Achieving this move could eliminate any bullish hopes above the EMA200 trendline. As a result, APT price could move towards the bearish channel of $3.1-$3.5.
Conversely, this bearish scenario will be tested if the price experiences a further bullish reversal and rises above the EMA200 trendline. In that case, APT price could try to test buyers’ patience at $5.7.