


On-chain data shows that the next major Bitcoin demand zone is around $56,000, a level that BTC could eventually reach again if the decline continues.
Bitcoin has the next major on-chain support around $56,000
This is evident from data from the market information platform InTheBlokBTC’s recent pullback has meant that it could ultimately rely on the price range around $56,000 for support.
In on-chain analysis, a level’s potential as support or resistance is based on the total number of coins investors last acquired there. Below is a chart showing what the different price ranges around the current spot price of the cryptocurrency look like in terms of this cost basis distribution.
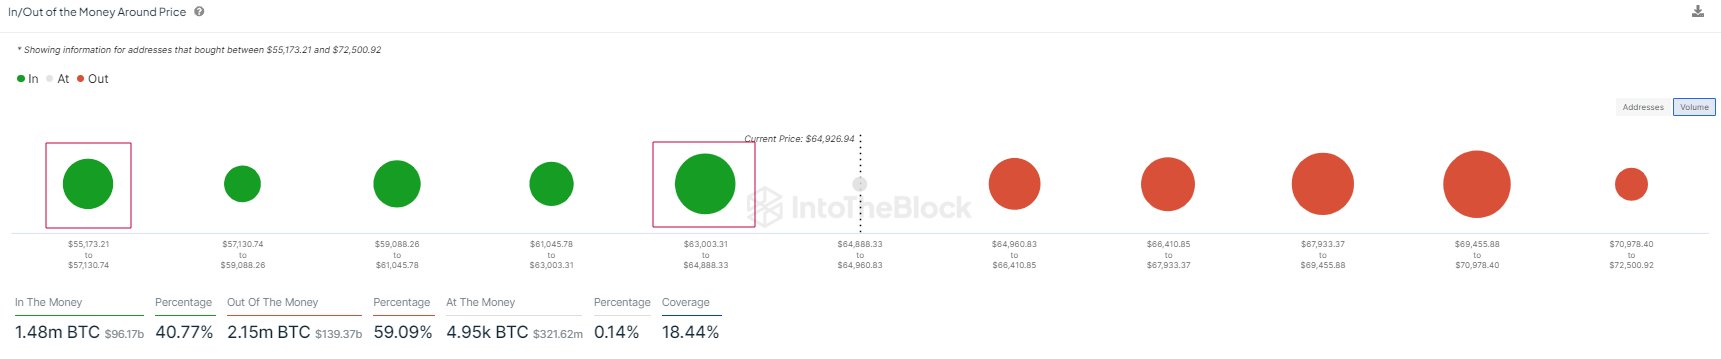
The data for the BTC acquisition distribution across the various price levels | Source: IntoTheBlock on X
In the graph, the size of the dot represents the amount of Bitcoin purchased within the corresponding price range. It looks like the $63,000 to $64,890 level is currently packed with investors. To be more specific, 1 million investors bought 530,000 BTC within this range.
When the asset retests an investor’s cost basis, he is more likely to make a particular move because of the importance the level has to him.
Investors who made profits just before the retest may be willing to make further bets, believing that if this level was profitable in the past, it could be so again in the future.
Of course, this buying effect would only be relevant to the market if a large number of investors acquired coins within a tight price range. The range of $63,000 to $64,890 qualifies.
The range should have acted as a support point for the coin, but BTC has recently slipped below it, possibly indicating that this support level may have broken down.
As IntoTheBlock has highlighted in the chart, the next major range of potential support is between $55,200 and $57,100. If the current decline continues, this could be the next relevant range.
“While this doesn’t mean Bitcoin needs to go this low, it’s good to keep this range in mind as the price explores recent lows,” the analytics firm notes. A drop in the average price of this range ($56,000) would represent a decline of almost 10% from the coin’s current cash value.
Before this level, however, there is another interesting level in the chain that BTC could eventually revisit. As analyst James Van Straten has noted in an X afterthe realized price (the average cost basis) of the short-term holders is currently approximately $58,800.
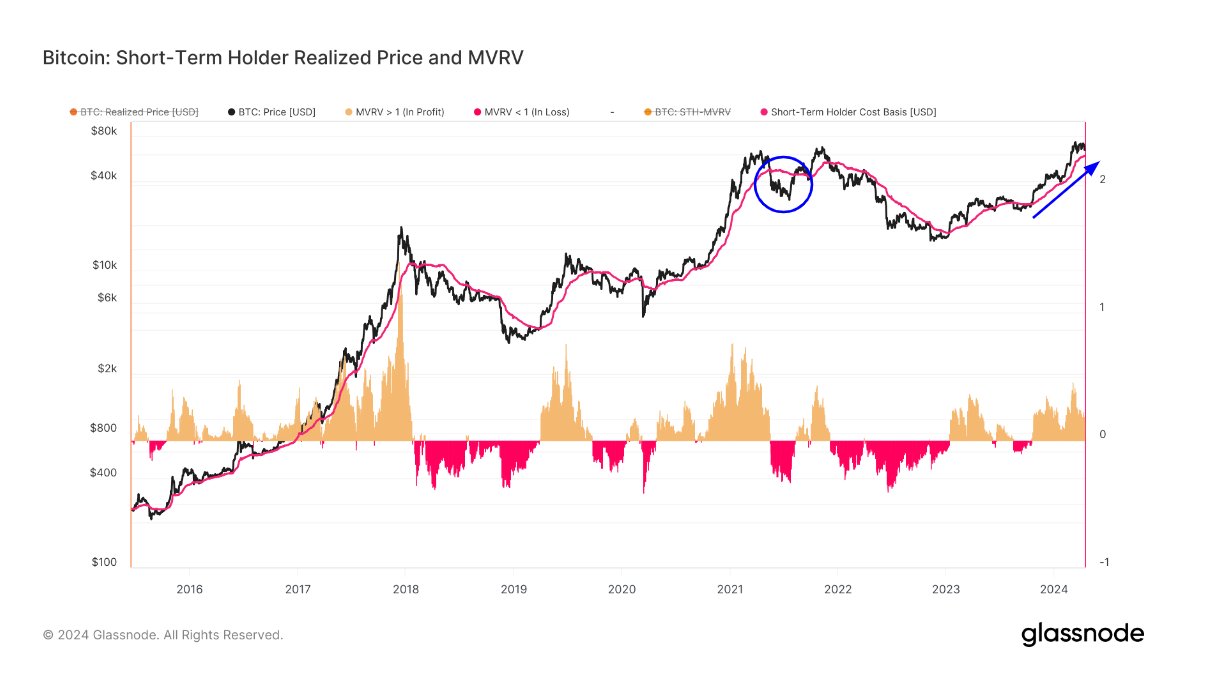
Looks like the value of the metric has been going up since a while now | Source: @jvs_btc on X
The short-term holders (STHs) here refer to the investors who bought in the last 155 days. This group’s realized price has historically been at key levels during bull runs, as the asset has often found support there.
Breaks below this have typically led to bearish transitions in the past. “If we fall below that, I will be succumbing to a bear market similar to May 2021,” Straten said.
BTC price
Bitcoin has registered a drop of almost 7% in the last 24 hours, losing all its recovery in the process. Now BTC is trading around $62,100.
The price of the asset appears to have been going down recently | Source: BTCUSD on TradingView
Featured image of Kanchanara on Unsplash.com, Glassnode.com, chart from TradingView.com
Disclaimer: The article is for educational purposes only. It does not represent NewsBTC’s views on buying, selling or holding investments and of course investing involves risks. You are advised to conduct your own research before making any investment decisions. Use the information on this website entirely at your own risk.