


After failing to break above the $72,983 resistance level, Bitcoin’s price has continued to decline. While Bitcoin’s price is still trading above the 1-day Simple Moving Average (SMA), this rejection has caused the cryptocurrency to fall from $71,942 to $66,785 and fall below the SMA in both the 1-hour and 4-hour chart. This drop below the SMA could trigger a change in character and the price will turn bearish.
At the time of writing the price is Bitcoin was trading around $67,635 and up 0.14% with a market cap of over $1.3 trillion and a 24-hour trading volume of over $25 billion. The market capitalization and trading volume have both fallen by 1.14% and 6.07% respectively in the last 24 hours.
Bitcoin price conditions in 4 hour and 1 day chart
As of the 4-hour time frame, BTC has fallen below the simple moving average. This indicates that the price of BTC could start to fall from this point.
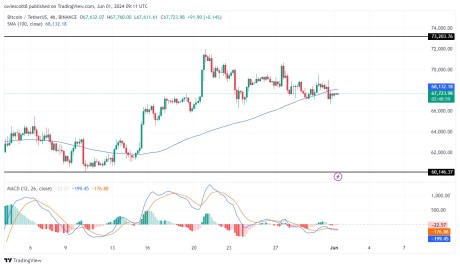
The 1-hour MACD also indicates that BTC could turn bearish as the MACD histograms are trending below the zero line. Also, the MACD line and the signal have crossed and are trending below the MACD zero line.
The 1-day chart shows this BTCThe price is moving towards the 100-day simple moving average. The 1-day MACD also creates a formation that suggests Bitcoin’s price could turn bearish as the histograms are already trending below the MACD zero line.
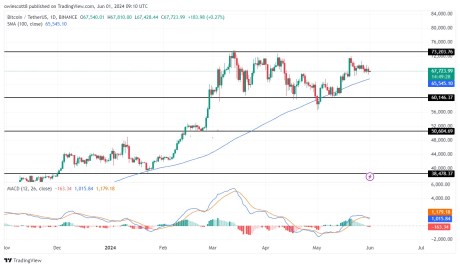
The MACD line and the MACD signal line have crossed each other and are heading towards the MACD zero line. If we examine the price formations and that of MACD from both time frames, BTC could experience a massive decline and likely start a bearish trend.
A path to a new record on the horizon?
Currently, there is one major resistance level at $73,203, and two major support levels at $60,146 and $50,604. As the price of Bitcoin goes bearish as predicted, the price will move down towards the support level of $60,146.
Should the price fall below this level, it could move further to test the $50,604 support level. There are also other support levels below $67,635, which BTC could test if there is a break below the $60,146 and $50,604 support levels.
However, given that the digital asset fails to break below any of the support levels mentioned above, it will start to rise towards the previous resistance level of $73,203. If the price breaks above this level, a new rally could begin, potentially creating a new high.
Featured image from iStock, chart from Tradingview.com