


Wyckoff Analysis (WA) aims to understand why prices of stocks and other market commodities move due to the dynamics of supply and demand. It is generally applied to any freely traded market where larger or institutional traders are active (commodities, bonds, currencies, etc.). In this article, we will apply WA to the cryptocurrency Cosmos ($ATOM) to make a prediction for estimated future events.

Cosmos Price Data from MEXC Futures | Source: ATOMUSDT.P on tradingview.com.
Link to the unedited image: https://www.tradingview.com/x/r8asKWOI
Cosmos $ATOM is currently in phase D of a Wyckoff accumulation schedule #1. Note the volume spike near where I placed the SC and Spring. In Wyckoff Analysis these should generally line up even if the overall shape is not perfect. The only minor anomaly is that the ST drops sharply below the SC and the ICE (not labeled) breaks. There are advanced diagrams you can find online that include many of these anomalous formations.
Phase D is where demand far exceeds supply, leading the rally to higher (or noticeably increasing) volume. When an LPS occurs, it is usually a favorable (even optimal) place for a long position. It has recently completed a reaccumulation, from which it is recovering strongly. Below are the typical schedules for both Wyckoff accumulation schedule #1 and a reaccumulation for reference.
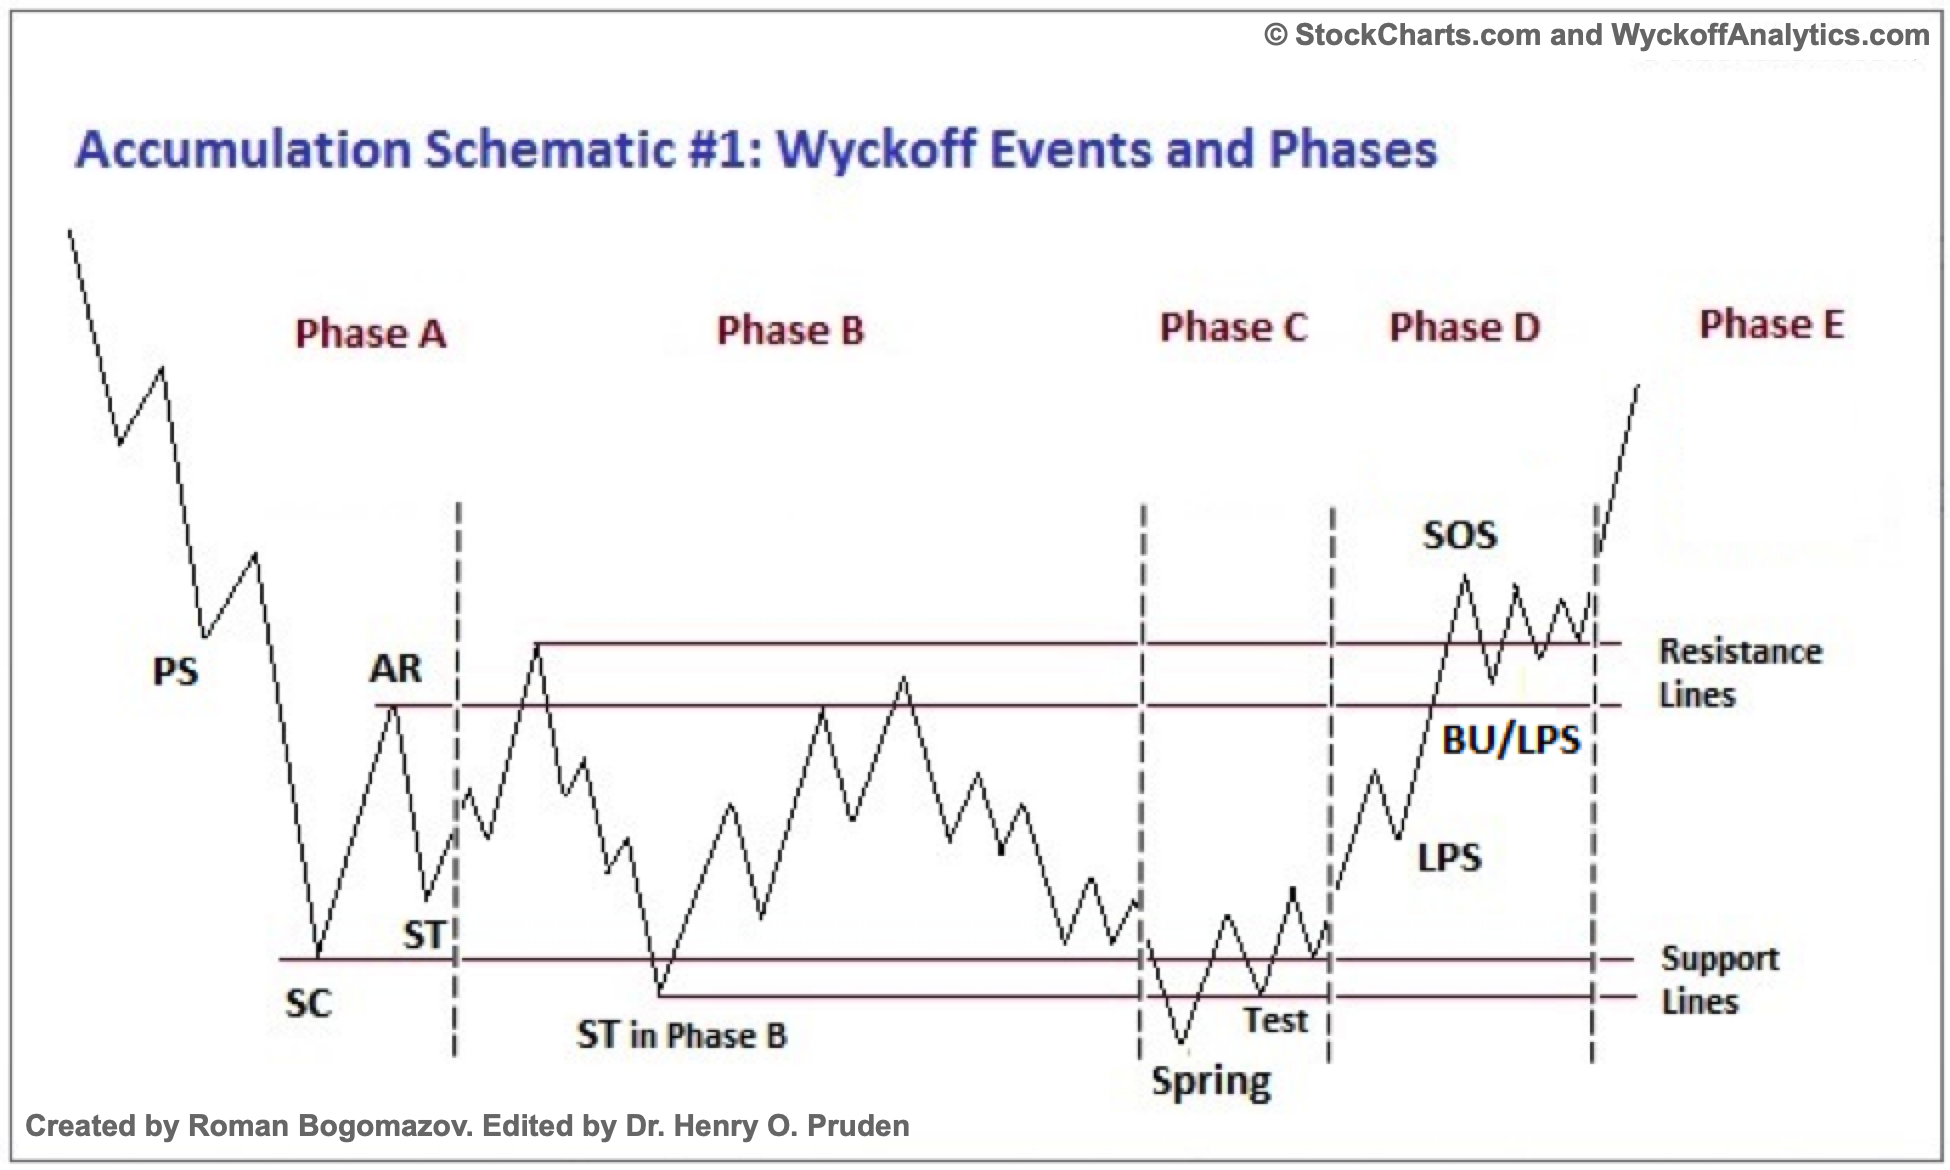
Wyckoff Accumulation Schematic #1 | Source: StockCharts.com

Wyckoff Reaccumulation Schematic | Source: StockCharts.com
Cosmos Price Targets
The basic target (according to the schedule) is the top of the trading range. In this case it is $18, but $15 is a provisional goal that must first be concretely achieved. If you do a little more work with the Horizontal Count method with PnF charts, you will get different results. My settings are currently a box size of $0.25 and a three box reversal on a high-low overview.
When using the Horizontal Count method, extensive congestion must be taken into account in a different way. The most important thing is finding the relevant column in and out to create the Congestion Box. In our case, this is spread over 7 bars from 13 to 20 December 2023. Since this is a reaccumulation outbreak, we need to add the value from the formula that uses the Horizontal Count.
7 x €0.25 x 3 = €5.25
The relevant low we need to add this to is $10.25, so the PnF target is $15.5.
Word list
All quotes are from the first link in Supplemental Reading.
Interim support (P.S) – “where substantial purchases are starting to provide clear support after a prolonged downward move”
Sales climax (S.C) – “the point at which widening spreads and selling pressure usually peak and heavy or panic selling by the public is absorbed by larger professional interests at or near a bottom”
Automatic rally (AR) – “occurs because the intense sales pressure has decreased significantly”
Secondary test (ST) – when “price revisits the SC area to test the balance between supply and demand at these levels”
Spring – “allow the stock’s dominant players to make a definitive test of the available supply before a markup campaign unfolds”
Test – where larger traders “test the market for supply during a TR”
Sign of strength (SOS) – “a price advance on increasing spread and relatively higher volume”
Last support point (LPS) – “a return to support that was previously resistance, due to reduced dispersion and volume”
Create backup (BE) – “a common structural element that precedes a more substantial price increase, and which can take different forms, including a simple withdrawal or a new TR at a higher level”
Additional reading
“The Wyckoff Method: A Tutorial” by Bogomazov & Lipsett
“Reaccumulation overview” by Bruce Fraser (2018)
“Jumping the Creek: A Review” by Bruce Fraser (2018)
“Distribution overview” by Bruce Fraser (2018)
“Introduction to point and figure graphs” from Stock Charts
“P&F price targets: horizontal counts” from Stock Charts
“The Wyckoff methodology in depth” by Rubén Villahermosa (2019)
“Wyckoff 2.0: structures, volume profile and order flow” by Rubén Villahermosa (2021)
Disclaimer: The article is for educational purposes only. It does not represent NewsBTC’s views on buying, selling or holding investments and of course investing involves risks. You are advised to conduct your own research before making any investment decisions. Use the information on this website entirely at your own risk.