


In recent weeks, Bitcoin has shown significant consolidation near the $29,500 range. However, it recently dipped below the $28,500 threshold. This move has led to strong selling sentiment in the market, a trend mirrored by Ethereum as well. Currently, Ethereum’s annual price chart indicates that it is at a pivotal point. There is a possibility that it will break its monthly support line, which could trigger another round of sales.
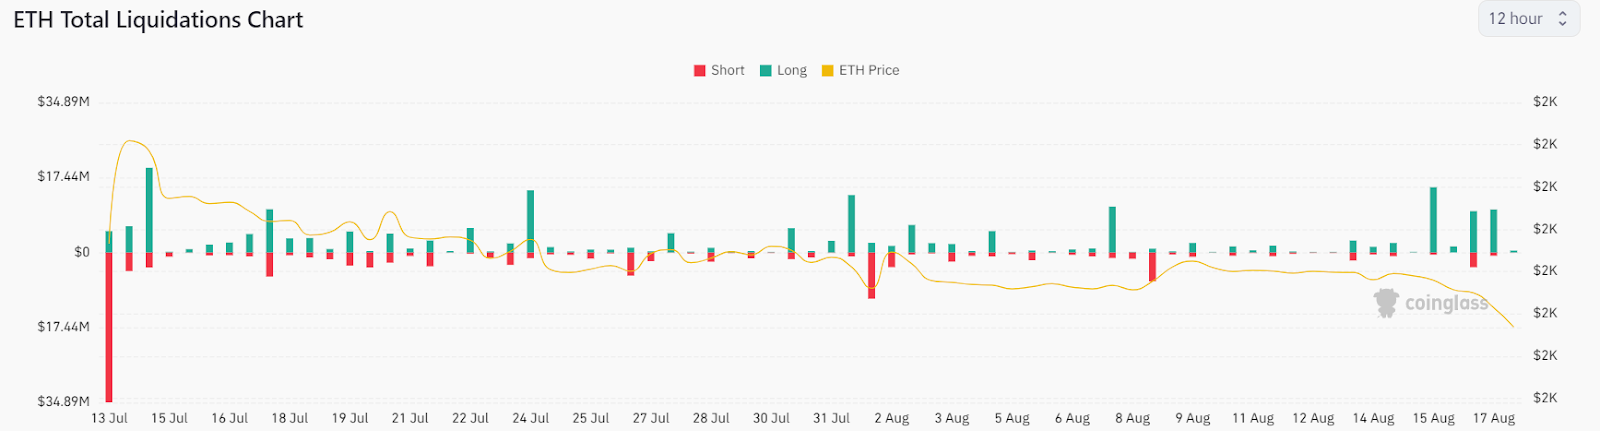
Bulls liquidated nearly $37 million in positions
Recently, the price of ETH saw a sharp drop, approaching the $1,850 mark. This forced long position holders to quickly lock in profits. Coinglass data indicates a long-term increase in liquidations, with more than $36.5 million in the past three days. This trend has intensified selling momentum at higher levels, creating a robust resistance near $1,850.
The 1-year price chart for ETH is showing signs of concern. Amid months of consolidation, Ethereum’s move within a category has market enthusiasts waiting for a clear trend, which could emerge in September.
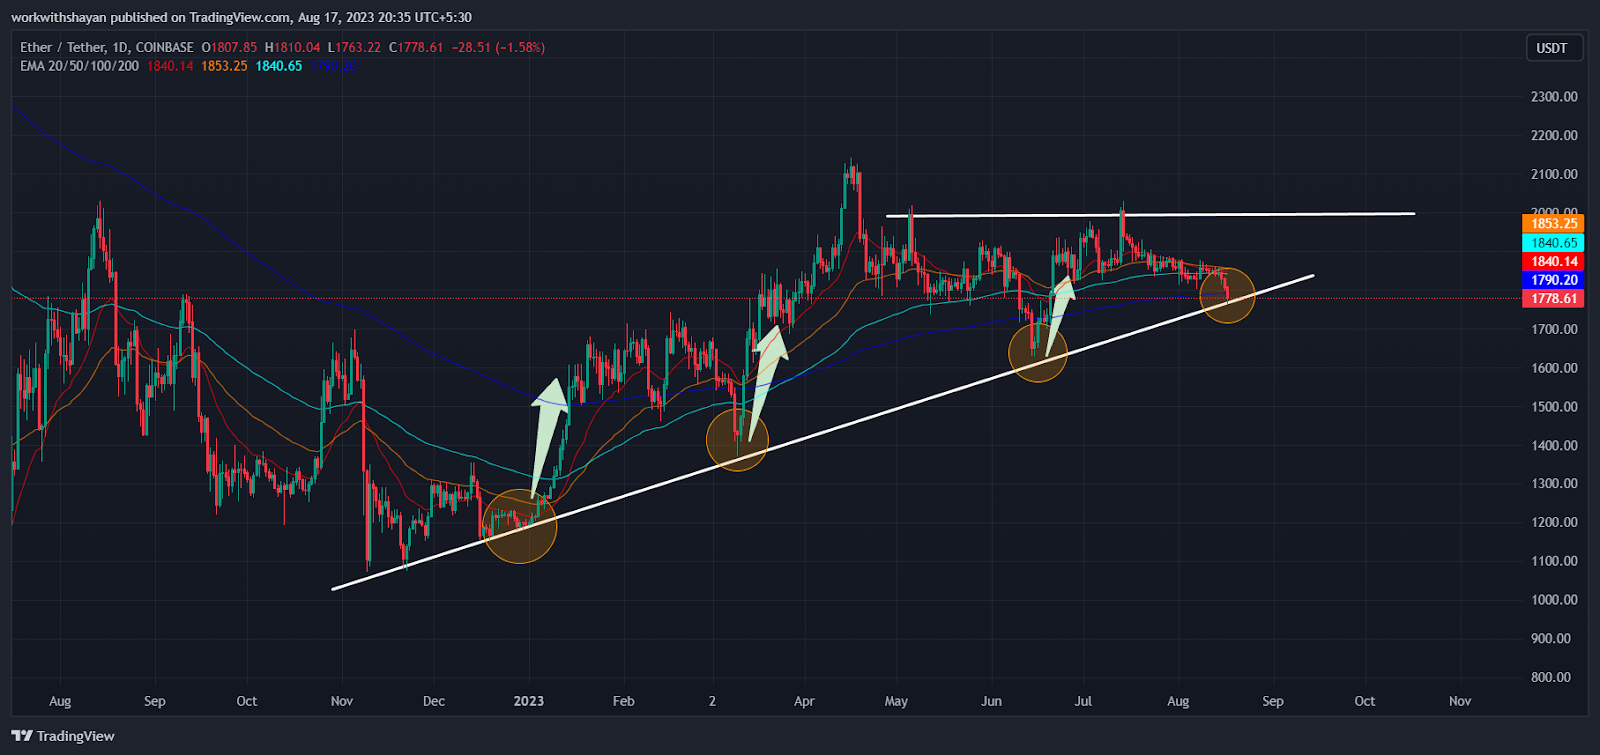
Since the collapse of FTX last November, the price of Ethereum has followed a rising wedge pattern. While it has consistently beat its support levels in the past, the pattern appears to be converging, indicating a final move. A drop below the support line could boost put holder confidence in the long run, with forecasts pointing to a possible drop to the $1,400 mark.
However, such a decline may require significant bearish news in the market. On the other hand, Ethereum has historically rebounded by 20-30% after successfully testing its support. If it manages to rise from the current support level of around $1,750, we could see an increase towards $2,000-$2,100.
What’s next for the ETH price?
Ether’s inability to maintain momentum above $1,800 has led to more selling, pushing the price down to a critical long-term support level of $1,850. However, bulls strongly defend a decline as there is buying pressure near the dip. At the time of writing, ETH price is trading at $1,776, down more than 1.7% in the past 24 hours.
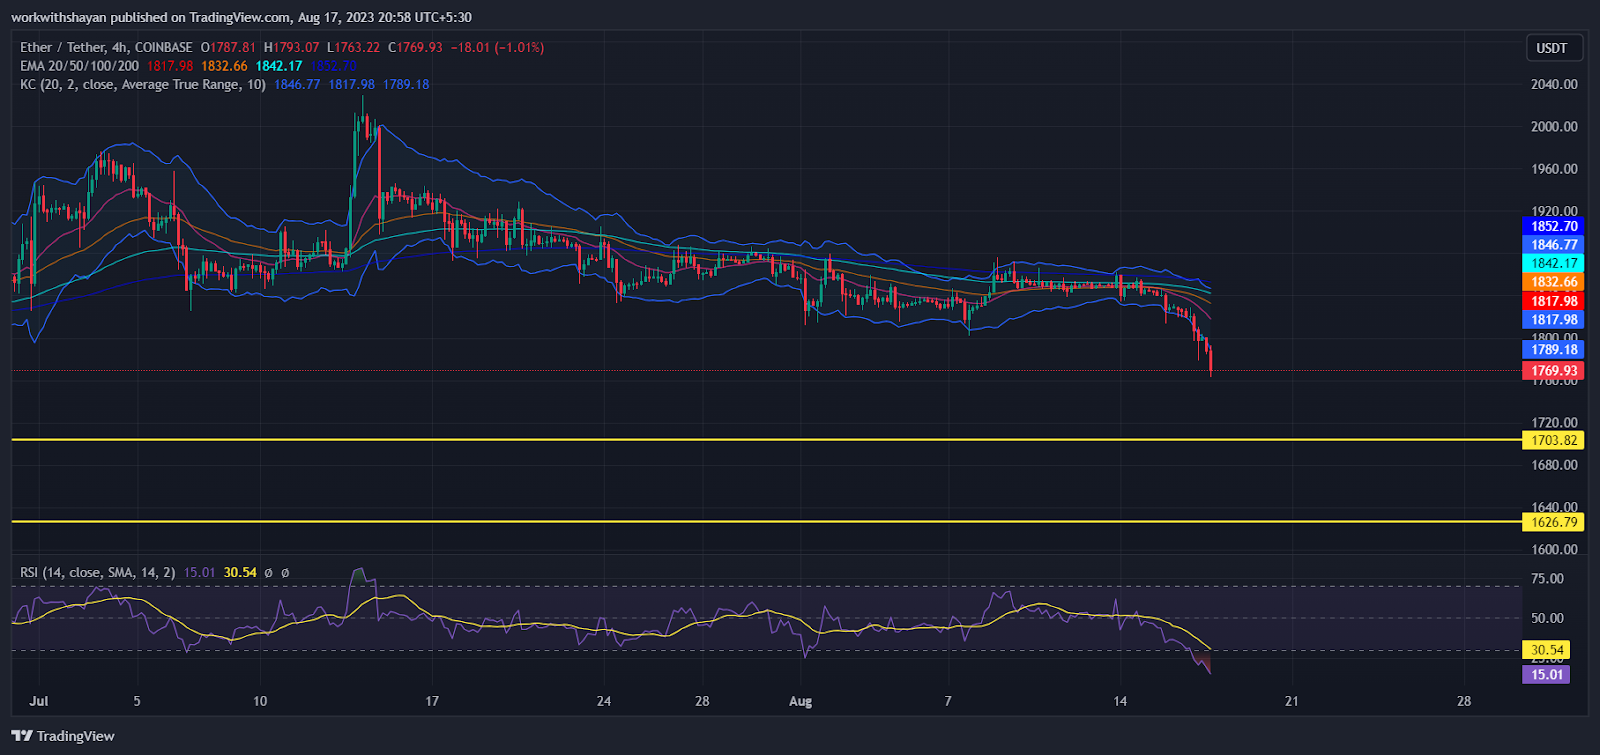
With the falling 20-day EMA and the RSI trading well below the level 15 sell zone, it indicates that the bears are currently dominating. If the price drops consistently and drops below $1,703, we could witness a sharper sell-off, possibly pushing ETH price to $1,626.
However, to turn things around, bulls need to push the price back from $1,850 and push the price past the 20-day EMA at $1,818. If achieved, it could pave the way for a consolidation move up around $1,860.