


After the halving event, Litecoin’s value experienced significant volatility and quickly dropped below key support levels. While many expected a bullish turnaround for LTC from these bottom positions, it lacked the necessary buying momentum. Still, current on-chain stats indicate that whalers are quietly making their move, possibly in anticipation of a robust bullish rise in the coming weeks.
Litecoin’s large transaction volume continues to rise
Lately, Litecoin (LTC) has been making waves with its steadily increasing transaction volume, indicating a renewed interest among traders. According to data from IntoTheBlock, Litecoin’s large transaction volume has increased over the past 7 days. The volume has increased from $1.74 billion to $1.84, suggesting that whale players are investing in the LTC market near the current dip.
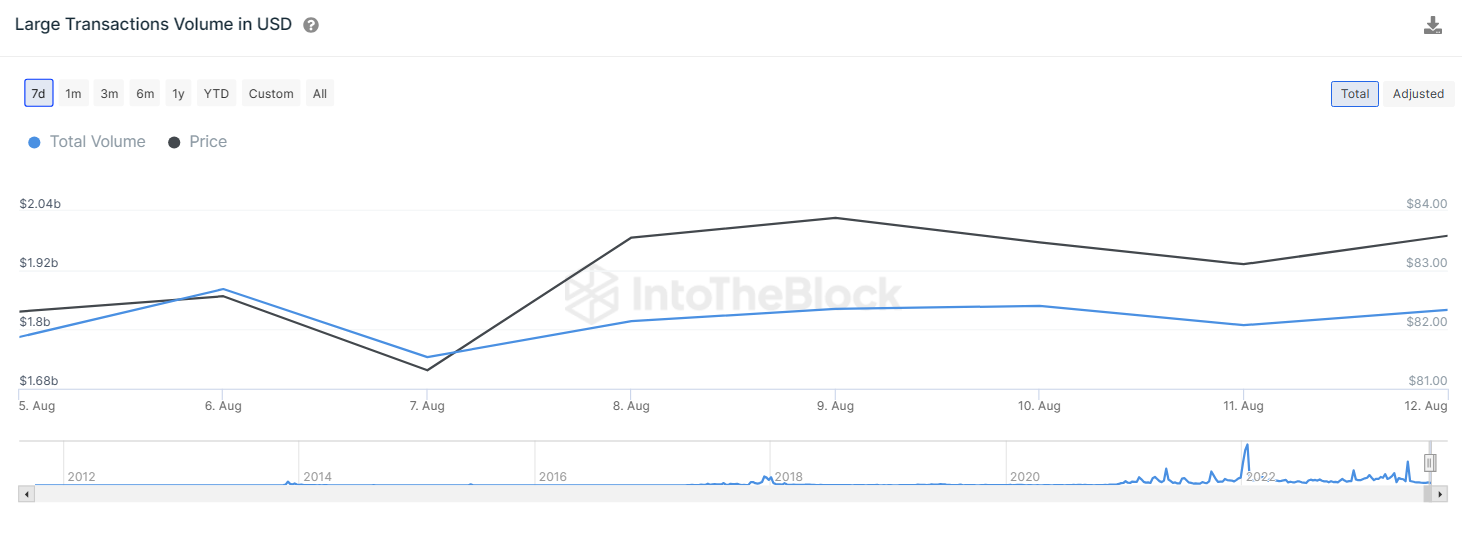
A consistent increase in volume often precedes a bullish trend, as it indicates strong demand and positive sentiment among traders and investors. In addition, it can lead to heavy liquidation of short positions if the LTC price makes an upward move due to buying pressure.
In addition to the existing positive indicator, there is another factor that could drive the bullish momentum for Litecoin: the recent behavior of its miners. Data suggests a significant shift in miners’ actions, particularly in their selling habits.
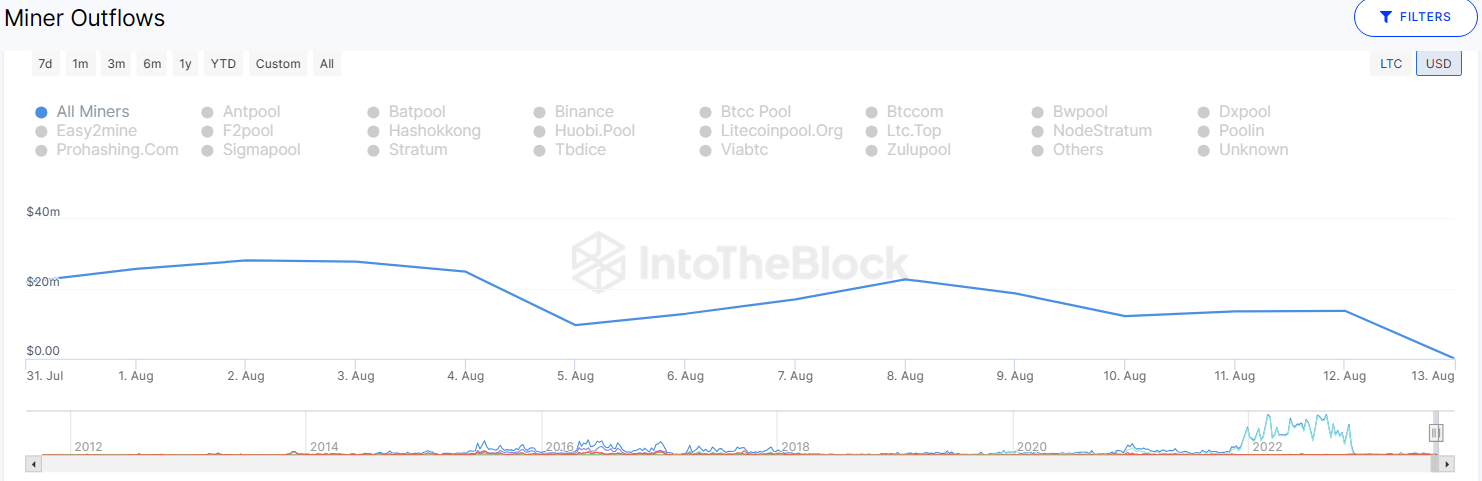
Over the past two weeks, the outflow of Litecoin miners has been significantly reduced. In particular, the metric, which measures the amount of Litecoin extracted from miners’ wallets, has dropped significantly. It plummeted from a peak of $28 million to a much lower $13.7 million.
With fewer Litecoins being sold by miners, there is a potential tightening of the coin supply in the market. A reduced supply, in combination with a stable or increasing demand, can exert upward pressure on the price. It is worth noting that the total supply limit for LTC is 84 million, with 73 million Litecoins already in circulation.
What’s next for the LTC price?
Litecoin faces challenges as it initiates a recovery from the USD 80 robust support level, which points to a lack of buying pressure near higher USD 85 levels.
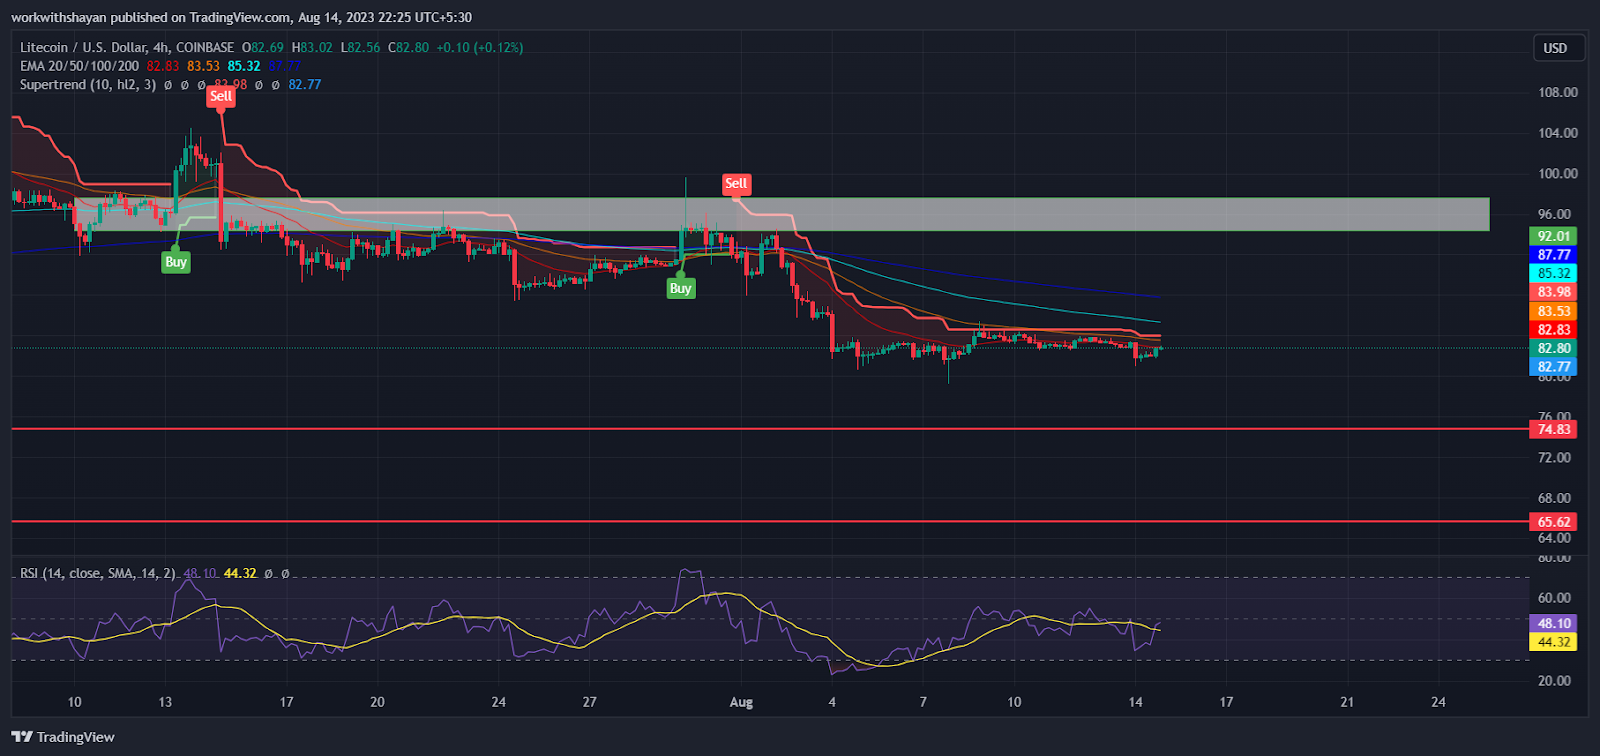
The falling 20-day EMA at $82.8 on the 4-hour price chart, coupled with the RSI below the centerline, suggests that the bears are currently dominating. If the LTC price falls and fails to stay above USD 80, it would indicate a solid downside correction. The next support levels to check are $74 followed by $65.
On the other hand, the primary resistance to observe on the upward trajectory is $85, which is predominant in the consolidation zone. If the price is driven above $88 by buyers, it could indicate the start of a bigger recovery, possibly rising to $97. However, this price could witness increased selling pressure.
Past performance indicates hope for bulls. After Litecoin’s halving in 2019, LTC rose to $400 in 2021, despite falling from $66 to $35 in December 2019.