


An analyst explained how Polygon is starting to break out of a symmetrical triangle pattern. If the outbreak is confirmed, there could be a rally to this level.
The weekly polygon price is about to break out of a symmetrical triangle
In a new after on X, analyst Ali talked about a pattern that has formed in MATIC’s weekly price. The pattern in question is called the ‘symmetrical triangle’.
As the name suggests, this technical pattern looks like a triangle. There are two major trend lines in this formation; the upper one is made by connecting a series of tops, while the lower one connects the bottoms. A characteristic of the pattern is that these two trend lines meet at approximately the same slope (hence the name ‘symmetric’).
There are also other triangle patterns in technical analysis, such as the ascending and descending triangles. For example, these patterns differ from the symmetrical triangle in that they have one trendline that moves horizontally, while in the symmetrical triangle they both move diagonally.
As is typically the case with these types of patterns, the upper trendline in the symmetrical triangle can act as a source of resistance, while the lower one can provide support.
A sustained breakout from any of these levels could lead to a continuation of the trend in that direction. According to Ali, Polygon’s weekly price was recently on the verge of such a breakout.
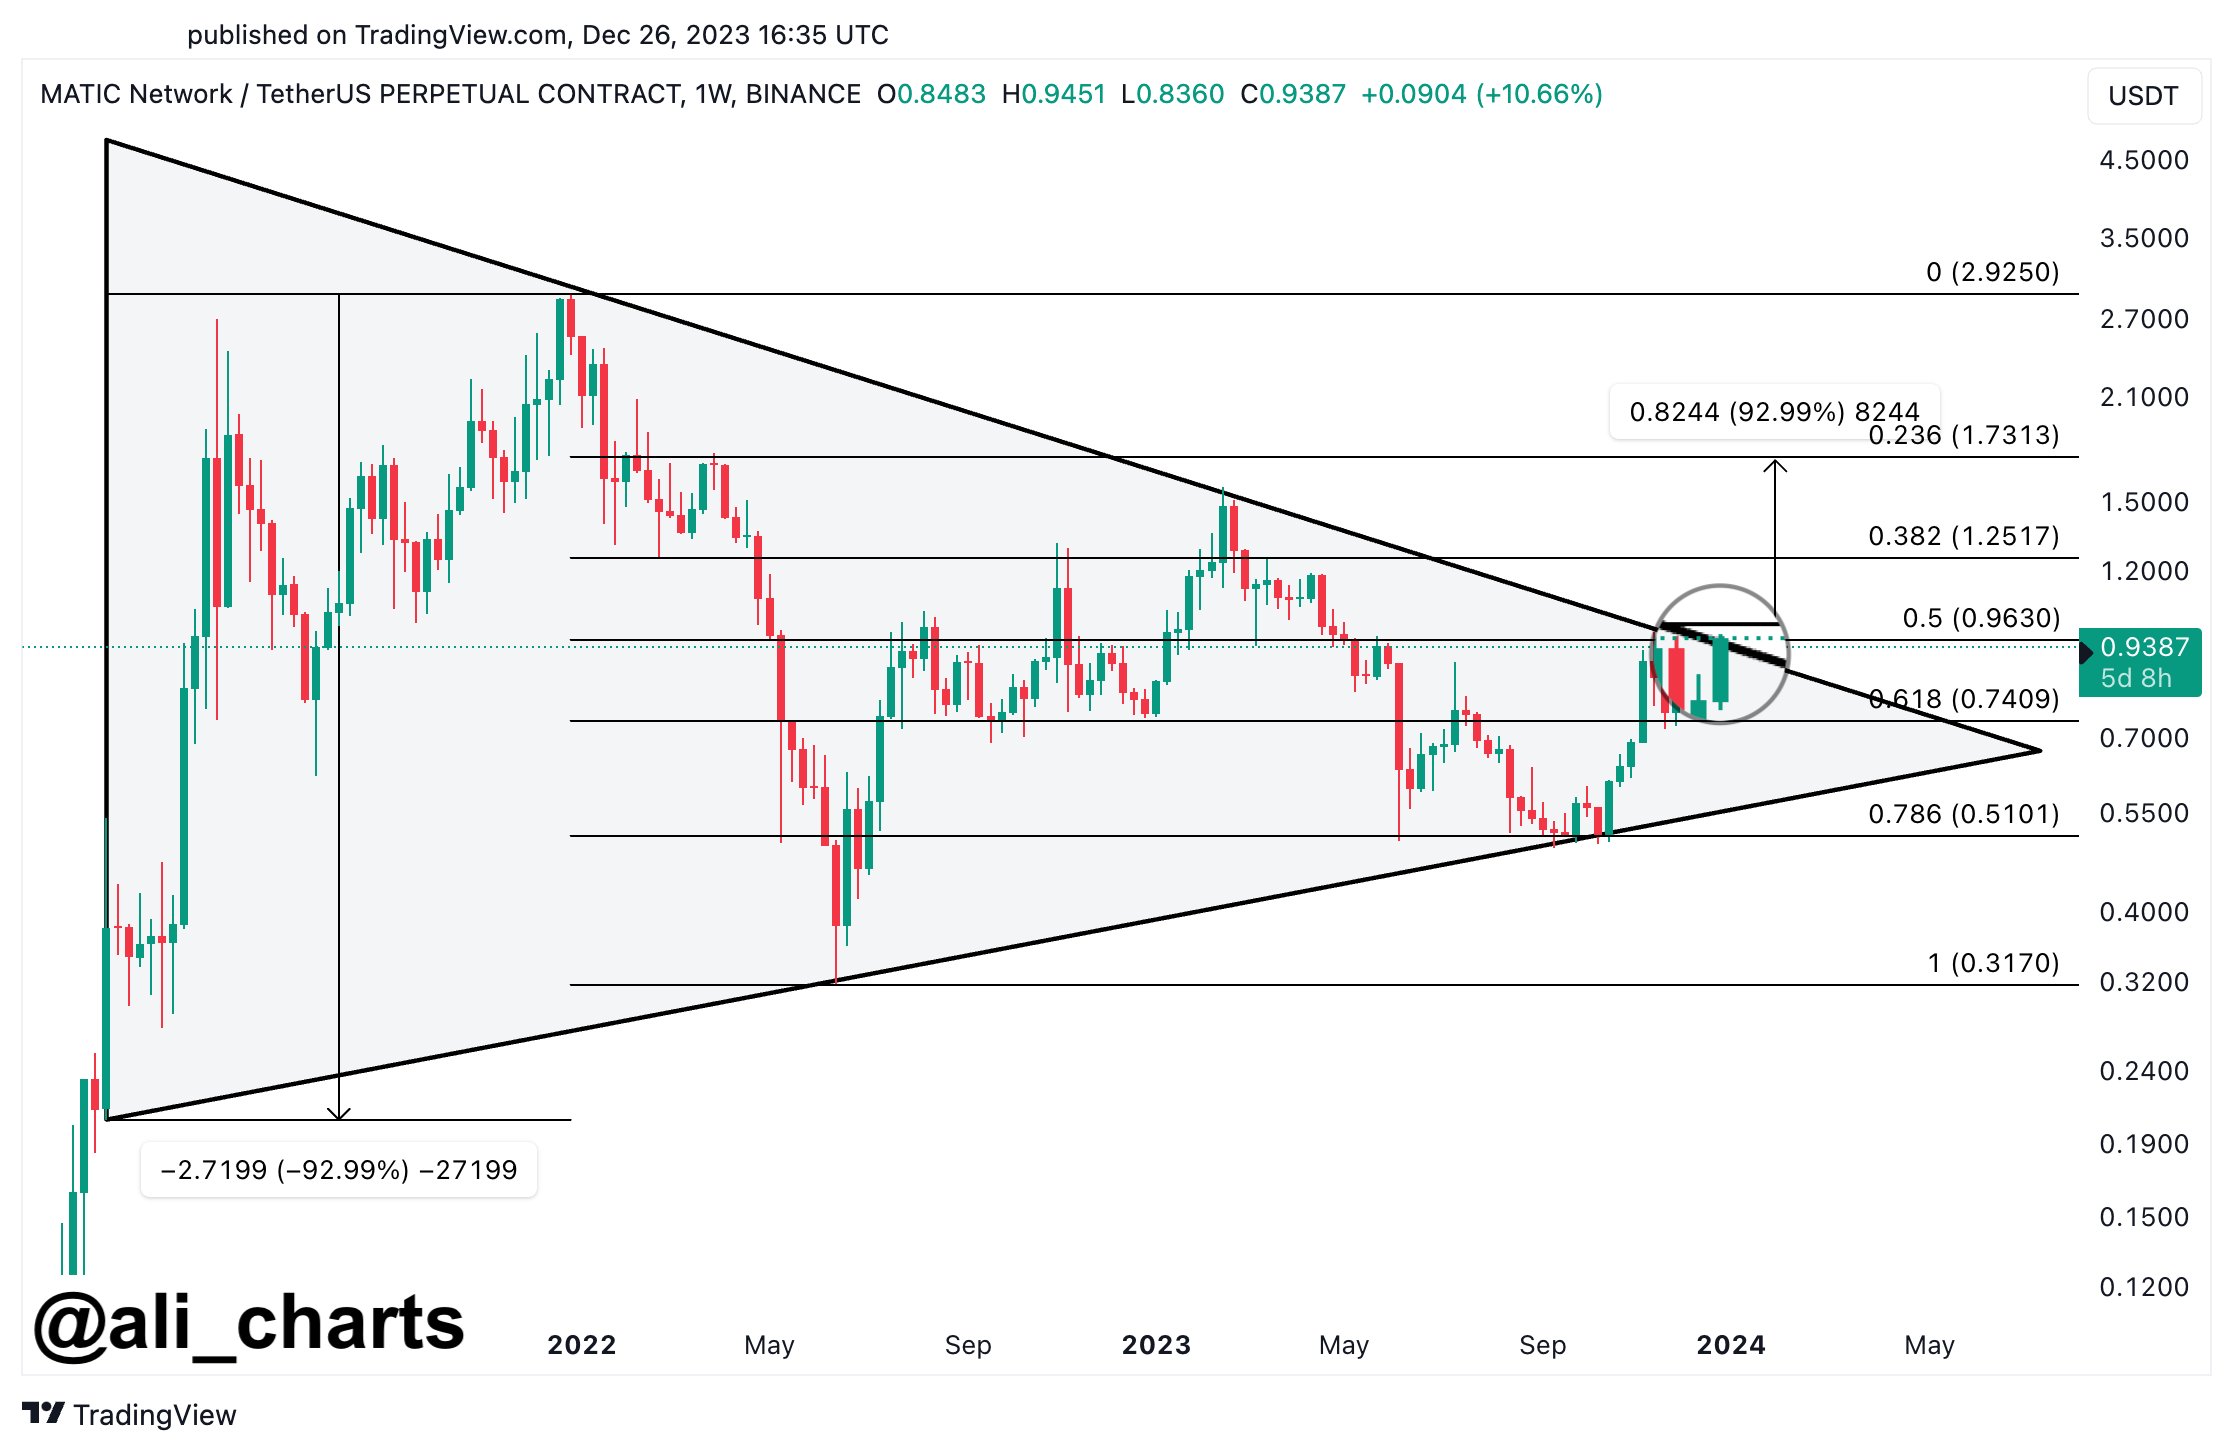
Below is the chart shared by the analyst highlighting this potential break brewing process in MATIC:

Looks like the price has approached the upper trendline recently | Source: @ali_charts on X
As shown in the chart above, Polygon’s weekly price has recently risen to the upper trendline of a symmetrical triangle pattern and appears to be trying to break out. “A sustained weekly candlestick near $0.96 could propel MATIC towards $1.73,” the analyst explains.
So far, Polygon seems to be on track to confirm this breakout as the price is up over 19% in the last 24 hours. If the symmetrical triangle break indeed holds, MATIC would need to gain another 66% from its current price if Ali’s target is to be achieved.
MATIC has surpassed the $1 level for the first time since April
Polygon has seen sharp bullish momentum over the past week as its price has now reclaimed $1, a level the cryptocurrency has not reached since April.
The chart below shows how the asset performed over the past month.
The price of the coin seems to have rapidly grown in recent days | Source: MATICUSD on TradingView
In the past week, the asset is up more than 34%. The only cryptocurrency in the top 20 market caps that has shown better returns is Solana (SOL) with a gain of around 47%.
It is currently unknown whether MATIC can sustain this rally, but if it does, the symmetrical triangle break would be confirmed and more upside could potentially follow.
Featured image from GuerrillaBuzz on Unsplash.com, charts from TradingView.com
Disclaimer: The article is for educational purposes only. It does not represent NewsBTC’s views on buying, selling or holding investments and of course investing involves risks. You are advised to conduct your own research before making any investment decisions. Use the information on this website entirely at your own risk.